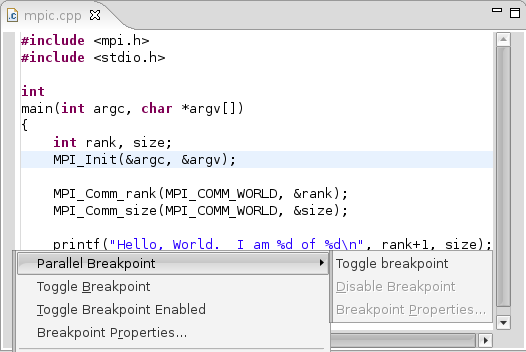
Eclipse's PTP tools allow you to perform parallel debugging. This means you can create a breakpoint in your parallel code and be able to stop each process (one for each node in the cluster) and inspect their state. The instructions below briefly describe parallel debugging in Eclipse.
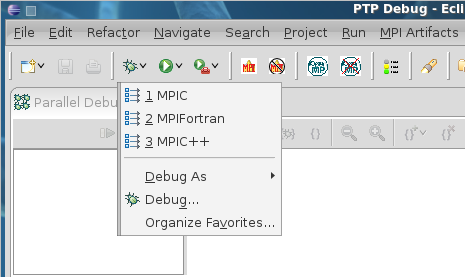
NOTE: You must create a parallel run for your project before attempting to debug it. Follow the steps in the section called “Setting Up a Parallel Run” if you haven't done so already.
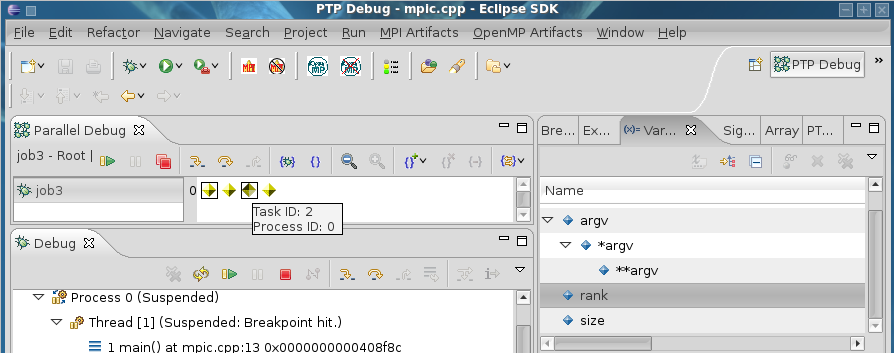
For a more detailed description of the Parallel Debugging perspective, see the section entitled “PTP Debug Perspective” under the "Switching Workspace Perspectives" subsection.


