This section will explain how to debug OpenMP code.
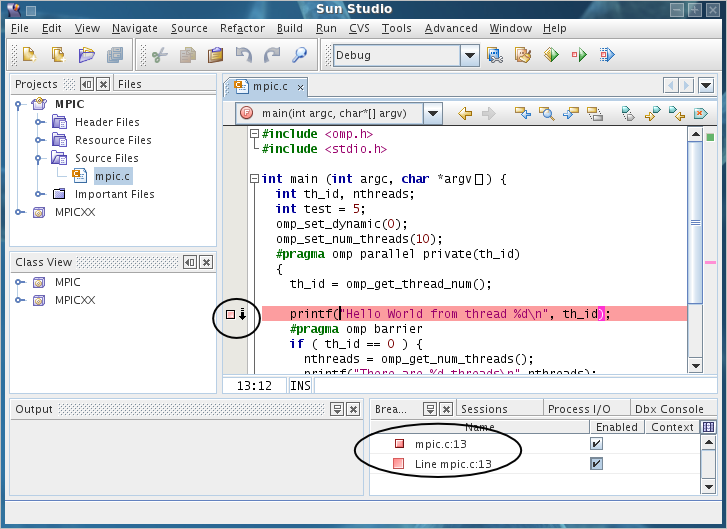
Open the source file you want to debug and click
on the grey space to the left of the line you want to
place a breakpoint at. This will add a red block to
the left of the line.
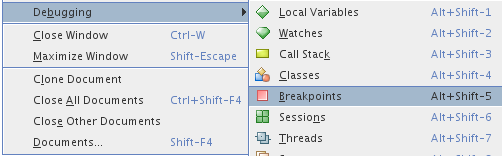
After setting your breakpoints you can take a
look at all breakpoints defined by going to Window →
Debugging → Breakpoints.
Right click your OpenMP project and select “Debug
Project”.
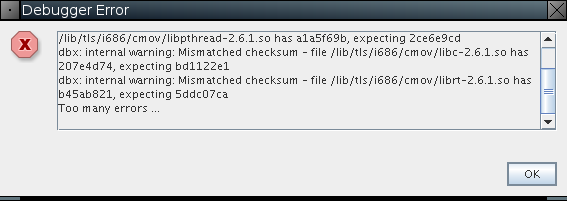
Using the StarHPC virtual machine image you might
receive the error shown below. You can safely ignore
this error by pressing “OK” and debugging will
continue normally. This is related to a bug in Sun's
dbx debugger.
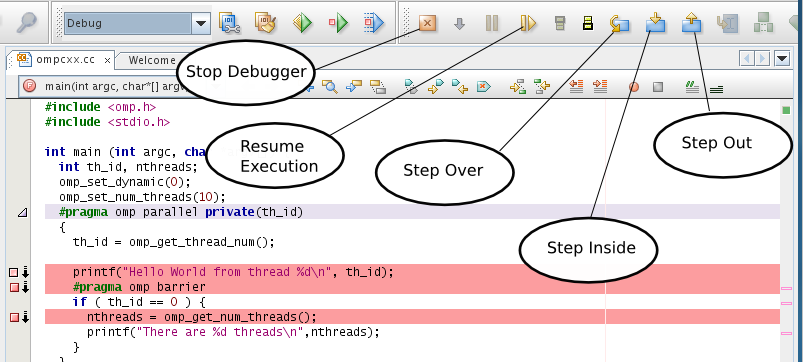
After the debugger starts, you will see a set of
debugging icons below the file menu.
Debug Functions
Step Over - Execute the current line of code
and pause at the next line
Step Into - Go into the method call at the
current line and pause at the first line of code
Step Out - Step out of the current function
call and pause at the next line.
Resume Execution - Resume code execution
without pausing until the next parallel
breakpoint is encountered
Stop Debugging - Stop debugging. This will
stop the parallel run and quit the debugging
session.
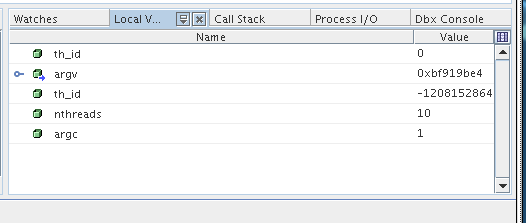
With the debugger started, you will see a set of
tabs towards the lower right of the screen. The
“Local Varibles” tab provides a list of variables for
the current thread.
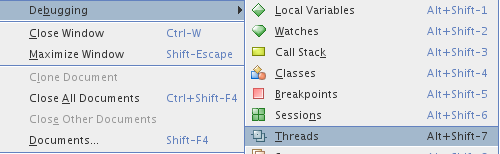
To switch threads go to Window → Debugging →
Threads.
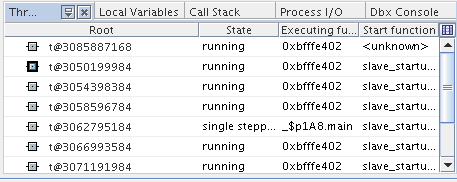
You will now see a “Threads” tab among the
others. Clicking this tab and double clicking to
select an alternate thread will refresh the local
variables list to show you each thread's local
variables.